next up previous contents
Next: Plot Data Up: Tools Menu Previous: Performing Alignments   Contents

Subsections

Phylogenetic Tree

The Phylogenetic Tree feature helps in determining the structure and sequence-based relationships between the aligned domains of proteins.
 
To do this, by default it uses a modification of Q that accounts for both gapped and aligned regions. This new metric, $Q_H$(see 10.2), creates a structure-based phylogeny that is congruent to the
Figure 13: Create Phylogenetic Tree Window
Image ptree1
sequence-based phylogenies. You can create a Phylogenetic Tree from the Tools menu in MultiSeq (See Fig. 13). Once you choose the sequences or regions you wish to create a tree for, you can choose which trees you want to create with the default being $Q_H$. Other options are RMSD (The root mean square deviation measures the distances in angstroms between the $C^{\alpha}$ atoms of 2 aligned residues), Percent Identity, or Sequence alignment (using either CLUSTALW or MAFFT). The tree viewer can also create a tree from a data file that you provide (if you have created tree data from an external program, for instance).

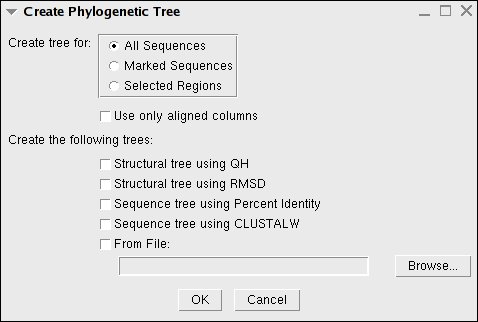
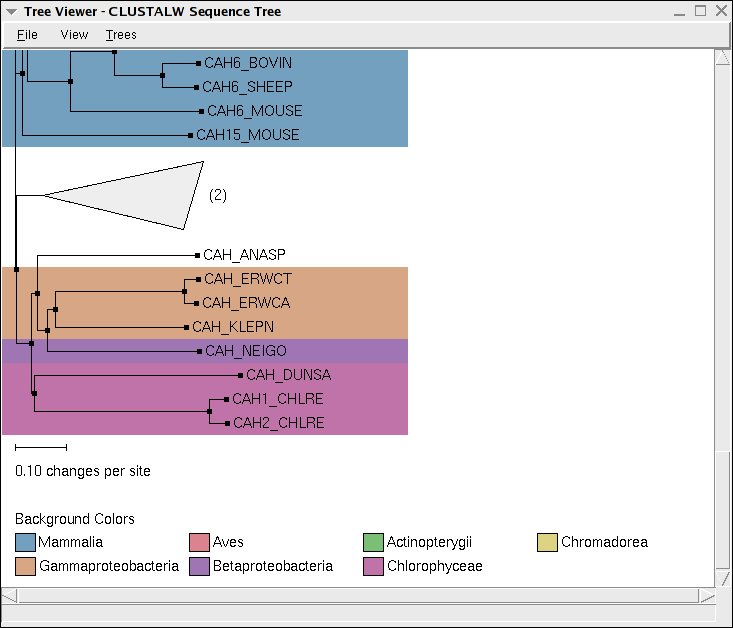
Once you have chosen which tree type to create, the Tree Viewer will be shown in simple black and white. But, you can easily use color and Tree View commands to make the data more useful (see Fig. 14).

Figure 14: Phylogenetic Tree Viewer - CLUSTALW Sequence Tree
Image ptreeView

Tree Viewer

The Tree Viewer window is very powerful. In the main window, you can right click on any small black box (in front of an individual sequence, or at any joint in the tree) and remove the element/subtree or look at its properties. Additionally, if you have selected a subtree by clicking on the outgoing line from the subtree, you can change the shape of the tree by rerooting it at selected point. You can collapse/expand a subtree, as shown in Fig. 14 as well

Menu options include:

File
Trees can be loaded and saved in common formats. Additionally, postscript renderings can be created for use in publications.
View
If a distance matrix has been created from the data, you can view it. You can also modify the way the tree looks. You can zoom in and out, change the scale (which pushes tree leaves left or right for viewability). Reverse orientation will move the labels from the left side of the tree to the right, and you can even choose whether or not you wish the tree to display the labels and nodes.

The Leaf Text option lets you choose the labels that you wish to have displayed, and you can color the labels using Leaf Color as well as the tree backgrounds using Background Color by a variety of different metrics.

You can easily collapse large parts of the tree by choosing a criteria using Collapse by, and, if you have selected a point in the tree, you can make that point the new root node of the tree using Reroot tree at selected point.

Trees
If you have chosen to create multiple trees, you can use this menu to rotate through the trees, or you can jump to one directly. Also, you can always select the $Q_H$ structure tree no matter what tree type you made to start with.


next up previous contents
Next: Plot Data Up: Tools Menu Previous: Performing Alignments   Contents
multiseq@scs.uiuc.edu